Abstract:
Data must be captured accurately and ultimately aggregated to generate knowledge and wisdom. The pathway to creating value from data requires effective people, processes, and technology. Each member of the healthcare team has a role to ensure data are captured in standardized coded fields in the EMR. Skilled data stewards define methods to extract data and aggregate those data to be shared. Communicating data to frontline users, administrators, and managers requires the creation of effective dashboard tools. Data experts with clinical backgrounds can help analyze data and incorporate into performance improvement tools.
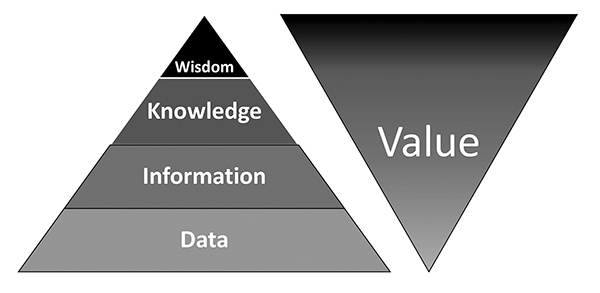
The U.S. healthcare system has become extremely dependent upon data. But data alone have limited value. Data become truly valuable when generating information, when that information creates knowledge, and when we ultimately derive wisdom from those data. It can be said that data and value are inverted, such that there is very little value in data alone, but tremendous value as data advance toward wisdom (Figure 1).

Figure 1. Increase in value as data are converted to information, information to knowledge, and knowledge to wisdom.
Several key steps are necessary for ultimately getting the most value from data and dashboards. Success starts with accurate entry of data into electronic records, upon which are built effective data displays once extracted. Ultimately value requires data that are actionable at the point of use and used effectively to drive improvement.
Data Accuracy
It seems obvious, but the most fundamental data issue is accuracy. This requires structured and reliable data input, clearly articulated standard data definitions, and robust processes to ensure data quality assurance. Electronic medical record (EMR) data are particularly challenging, because they often are entered by multiple team members with variable workflows and skills. Each member of the team must enter data with precision. For example, office staff enters demographics, including elements such as preferred language and insurance information. These simple data fields not only drive powerful processes across the system, but ultimately become key sorting functions for quality and financial drivers. Similarly, nurses or medical assistants enter key pieces of history and often record the initial clinical data such as vital signs and patient reported screenings. The data these clinical team members enter are critically important, allowing the providers to focus on their more sophisticated care delivery, yet those data elements must be recorded accurately in order to drive key EMR processes. Lastly, providers are responsible for documenting key pieces of clinical information, including their physical exam findings and their assessment and plan. To the degree these data are entered into coded fields, they are then available for extraction toward value.
Although many providers are using dictation and natural language processing as a mechanism to ease rich prose-based language entry, unless information is captured with structure, it may not be available for future extraction. Some are experimenting with team-based documentation or scribes, which adds expense, but is better able to utilize coded data fields in the EMR. The EMR is a powerful tool, but to ensure comprehensive and accurate data collection, policies and procedures that document workflows specific to team roles are required.
Mechanisms are available to help all users to capture data most effectively. Clinical decision support at the point of use, best practice advisories, and order sets are examples that drive all users’ compliance with entering data in discrete fields that can be electronically extracted. Further benefit of clinical decision support includes improving standardization. Similarly, use of flowsheets is valuable for capturing certain types of data at the point of entry, such as vital signs and test results.
It is extremely important for data accuracy that standard taxonomies are used across systems. For example, diagnoses should link to ICD 10 codes, procedures to CPT codes, labs to LOINC codes, and medications to NDC identifiers. Patients must have unique identifiers within EMRs, and even require common demographic identifiers to link across the EMR and health information exchanges. Similarly, providers must be identified in a structured format, such as the national provider identifiers (NPI).
Once data are captured accurately, skilled data analysts and report writers are needed to create valuable information from the raw data. Data stewards, who have a clear understanding of the data use, create data specifications with an understanding of how the data are stored and entered into the EMR. They leverage coded data sets using data definitions, noting that many data points have multiple ports of entry or definitions in the EMR. They must create data definitions and groupers that can be used repeatedly in reports and clinical decision support. Use of internal registries in EMRs is another way to create populations and cohorts of patients that can be used repeatedly for reports or clinical decision support. A best practice between the data steward and the report writers is to review specifications in person to ensure a common understanding of exactly what is needed and how the data will be used.
Just as there are roles in data entry, there are also key roles in report generation and quality assurance. Report writers are programmers who pull data out of the system into standard report formats. They conduct basic quality assurance to ensure the data output meets the specifications. Data analysts and data stewards then work to review, understand, and refine reports in greater detail based on their knowledge of the metric and clinical situation. This second review is more contextual in nature than the report writers’. Having front-line clinicians as part of the data team helps ensure accuracy and validity. It is strategically beneficial to select clinicians who scrutinize their data the most. Making these clinicians part of the data team adds elements of integrity and detailed oversight, because they have the most intimate knowledge of the data.
Data Displays
Effective and pleasing visual displays of data must be created for the data to be used most effectively. This is the next step in creating knowledge from information. In the simplest form, data should be shared using combinations of color, tables, graphs, and text. Just as in an automobile dashboard, users should be able to obtain key information at a glance and have the opportunity to drill down for more information when relevant. These visual displays may include tables, run charts, heat maps, bubble graphs, and pie, bar, and line charts.
Dashboard reports often take advantage of stoplight colors, with green indicating reaching target and red indicating failure to do so. It is often valuable to use color or arrows to show trends from month to month or reporting period to reporting period. Run charts show progress over time and can compare multiple providers, units, or entities with benchmarks. Heat maps can be used to geographically show population concentrations (e.g., emergency department utilizers), with deep red often indicating highest density and decreasing intensity represented through pinks and blues. Bubble charts often are effective for showing outliers based on correlations, using bubble size to represent impact such as cost. Multicomponent data displays can be effective in joining disparate data sets when presented graphically overlying companion data. When a user initially looks at the data, he or she should know the “punch line” right away based on how the data are displayed.
It is the role of data teams to add focus and simplicity.
To be of greatest value, data must be actionable, meaning that those reviewing the data should be able to derive clear conclusions and make decisions based on those data. This involves communicating data effectively in multiple formats, allowing for a drill-down capability, and ensuring that users are able to filter by data key elements. As effective as data can be to drive success, ingesting data can be overwhelming. It is the role of data teams to add focus and simplicity. When pushing data to large user groups, it is useful to create a prose text summary of key information. One can create hot links within text summaries to allow users to click immediately to stored dashboards. Those dashboards will then take users to greater levels of detail in the reports.
Deriving Wisdom From Data
When data help to tell a story, learning is the result. Data can be leveraged for greater wisdom by, for example, embedding snapshots of graphically captured data within performance improvement plans, strategic plans, and board reports. The ability to create flexible data displays using multiple elements to filter gives users the ability to adapt data to their individual needs. In this way, data can be used by administrators, practice managers, and individual providers or staff members, depending on the level of detail they require for action. Filtering also helps aggregate data in various ways to help discover trends that otherwise might not be obvious to system leaders. For example, data can be filtered by specialty, by location, or by campus. Each data slice tells a different story.
In order to ultimately drive value, it is important to benchmark effectively, ensure data are transparent, link data to institutional governance and accountability, and ultimately use data to align incentives. One example of benchmarking is to share data with external registries, often supported by specialty societies. When sharing data with national registries, one must follow common interinstitutional data standards. This rigor creates a greater challenge, but allows the benefit of very clear benchmarking. Many national quality programs are built off of specialty registries that ultimately are derived from granular data at an institutional level.
When provider-level data are shared transparently, it creates a sense of accountability and ownership driven through pride and peer pressure.
Transparency is another key principle. When provider-level data are shared transparently, it creates a sense of accountability and ownership driven through pride and peer pressure. In a busy clinical environment, clinicians are able to use each other as a benchmark, leveling the playing field. Collaborative and broadly representative data benchmark setting is critical to leveraging effective and positive peer pressure. Including clinicians across an institution generates buy-in and helps with engagement in data usage.
To ensure accountability, health systems should have a data oversight board with line of sight to the frontlines across the institution. Common dashboards can be shared across units and entities, holding leaders accountable for execution at the front lines. One layer down, within entities and institutions, units are then held accountable for their data. Ultimately, within units, departments, or practices, individual providers often are then held accountable for their data. If everyone is following standard definitions and formats, this creates alignment and accountability. This fractal approach (as in the leaf of a fern) is a scalable approach to quality leadership that has been shown to be of great value in large healthcare organizations.(1,2)
The ultimate mechanism of accountability is through aligned financial incentives. As compensation models for providers and leaders evolve to include more measures of quality, safety, and value, data become critically important to driving success. Indeed, most institutions and practices are now compensated by payers, either federal or private, through some mechanism of performance-based payment. Accurate data at institutional level allow for effective projection and budgeting as well as ultimately fair and equitable compensation models.
Conclusion
Data have never been more ubiquitously available within healthcare. Providers, managers, and system leaders often are overwhelmed by the types of data and how to derive meaning. Creating the greatest value from data elements requires effective people, processes, and technology. With structured data entry, standardized EMR workflows, and emerging data aggregation and dashboarding software, institutions and systems can best achieve the ultimate data goal: wisdom to advance quality and safety, reduce unnecessary waste, and add value at the patient and societal level.
References
Pronovost PJ, Marsteller JA. Creating a fractal-based quality management infrastructure. J Health Organ Manage. 2014;28:576-586.
Kravet S, Bailey J, Demski R, Pronovost P. Establishing an ambulatory quality and safety oversight structure, leveraging the fractal model. Acad Med. 2016; 91:962-966.
Topics
Performance
Strategic Perspective
Technology Integration
Related
Life’s Lessons From the Baseball DiamondThe Power of Metaphors When Introducing Change InitiativesManaging a Slob

